Influenza Season in the US
with Tableau
Project Background
The US has a flu season where more people than usual suffer from the flu. Since more people, especially vulnerable populations, may be hospitalized, the medical staffing agency requires assistance determining where and when to send extra stuff.
Objective
Use historical data to inform the deployment of extra health care workers during flu season.
Hypothesis
States with a higher number of vulnerable populations will have more influenza mortalities.
Skills
- Translating business requirements
- Data cleaning, integration & transformation
- Stat. hypothesis testing
- Time Series
Tools
- Excel
- Tableau
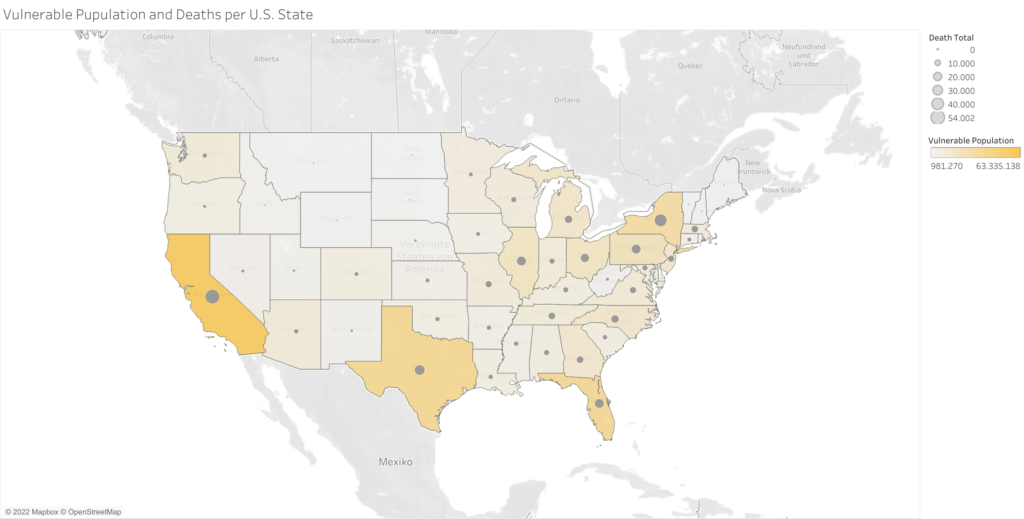
Which states are mainly effected by influenza deaths?

Looking at the map, it becomes clear that the states with the highest death rates are also those with a high density of vulnerable people (65+ years).
California, Texas, Florida and New York are particularly affected.

Which states are mainly effected by influenza deaths?


When is the Influezena Season in the US?

For most states, flu season is between December and April each year. Influenza season is mainly during winter or colder months in the US.
Conclusions & Recommendations
The visualizations based on the provided data clearly show which states and people are most affected by influenza deaths.
Vulnerable people are aged 65 or older. Many live in California, Texas, New York, and Florida. The Influenza Deaths timeline also shows that influenza has a clear seasonality in the northern hemisphere winter.
Therefore, additional staff should be sent, especially to the above-mentioned states, in the winter (December to March).
