Online Grocery Shopping
with Python & Excel
Project Background
The online grocery store would like data-driven insights into customers and purchasing behaviours. They want to use this analysis to inform a targeted marketing strategy.
Objective
Perform an initial data and exploratory analysis to derive insights and suggest strategies for better customer segmentation based on the criteria.
Question
Insights into customers’ purchasing behaviors based on age and customer profile
Skills
- Data wrangling and merging
- Deriving variables
- Grouping and aggregating data
- Visualizing in Python
- Reporting in Excel
- Population flows
Tools
- Python
- Excel
What are the most popular departments?


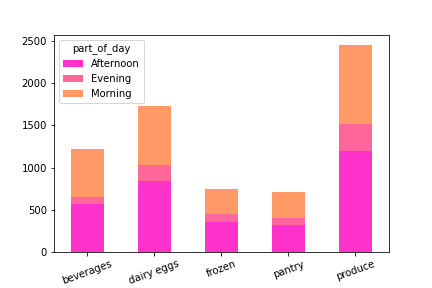
The most popular segments are produce (35.8 %), dairy eggs (25.1 %), beverages (17.8 %), frozen (10.9 %) and pantry (10.4 %). These products are more or less equally requested around the different regions.
The departments have most sales in the afternoon and the mornings.

How can we segregate the customers?


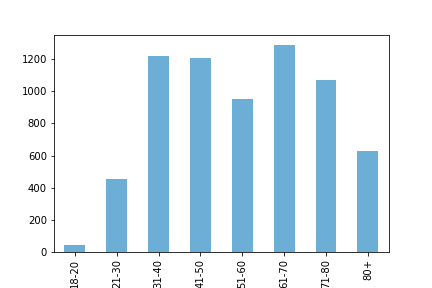
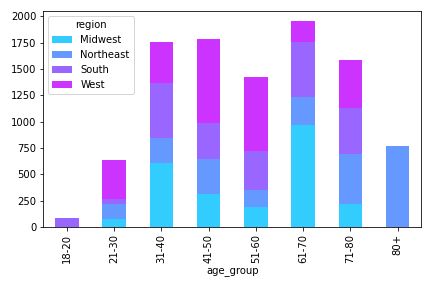
Segmenting the customers by age groups, it becomes evident that most are between 31 and 50 and 61-70. Looking into the geographics of the customers, we see many live in the West and Midwest states of the US.

Looking deeper into the spreading of the customers, we segmented the customers into high and low spenders. Most of the high spenders are within the age group of 31-40.
It is also clear that most female clients are married or divorced/widowed, which also fits the age structure of the main clients.

Conclusions & Recommendations
- Advertisement should be done mainly in the mornings and afternoons as the sales are highest in these hours
- Investigate what type of products in mid-range are most popular and run ads of similar/complementary products that are categorized as high-range products
- Design campaigns such as vouchers or coupons that would benefit pensioners
- Encourage customers to be more loyal by offering discounts if they recommend Instacart to friends
- Expand assortment
